
GEOGRAPHIC CONSIDERATIONS
WHAT GEOGRAPHIC AREAS ARE BEST SUITED FOR SOLAR ENERGY? IS THERE A U.S. SOLAR ENERGY “MAP”?
The following map highlights the global horizontal irradiance across the U.S. states:
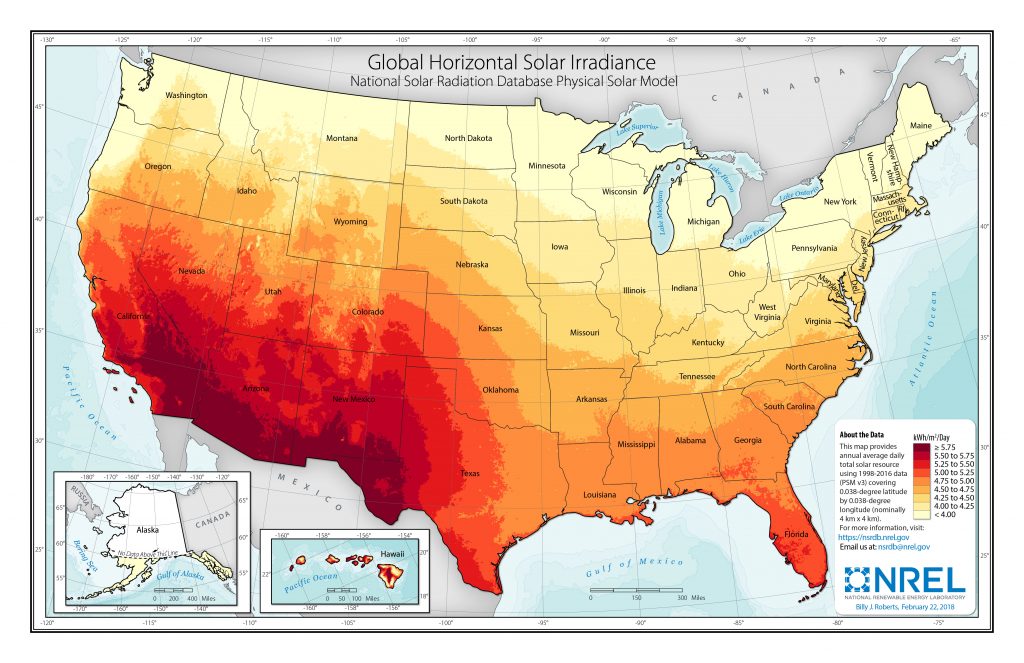 Source: U.S. Department of Energy, National Renewable Energy Laboratory [1]
As illustrated by the map, solar radiation levels in the southwestern U.S., including southern California, Nevada, Arizona, New Mexico, Colorado, and Utah, are the highest, and therefore best suited for utility-scale solar energy development.
The Federal Energy Management Program (FEMP) offers a variety of renewable energy resource maps and tools. The FEMP screening map is an interactive map that examines the viability of three solar technologies in the United States with a high-level annualized economic calculation, with and without potential savings from available renewable energy incentives at the state and federal levels. The map below is an example of the data that can be explored.[2]
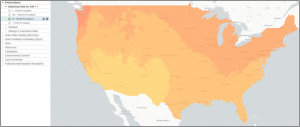
Source: U.S. Department of Energy, National Renewable Energy Laboratory[3]
The Solar Energy Industries Association includes an interactive map of state by state solar market insights and policy updates as of Q4 2021.
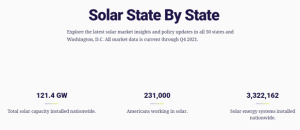
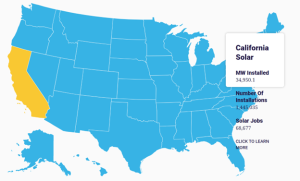
Source: Solar Energy Industries Association[4]
Updated by Jennifer Ostromecki, November 2023
Comments are closed.